在昆山团队退出后,我们还额外负责了原来昆山做的【工作台】、【统计报表】部分。本文的代码在他们的基础上开发,大部分我做了一定幅度的改动。
4 统计报表 【统计报表】模块用于展示该公司的设备销售数据或故障数据。从这里开始,其实已经是纯前端工作,之后用到了大量的图表,我都是使用 Apache ECharts 进行开发的。
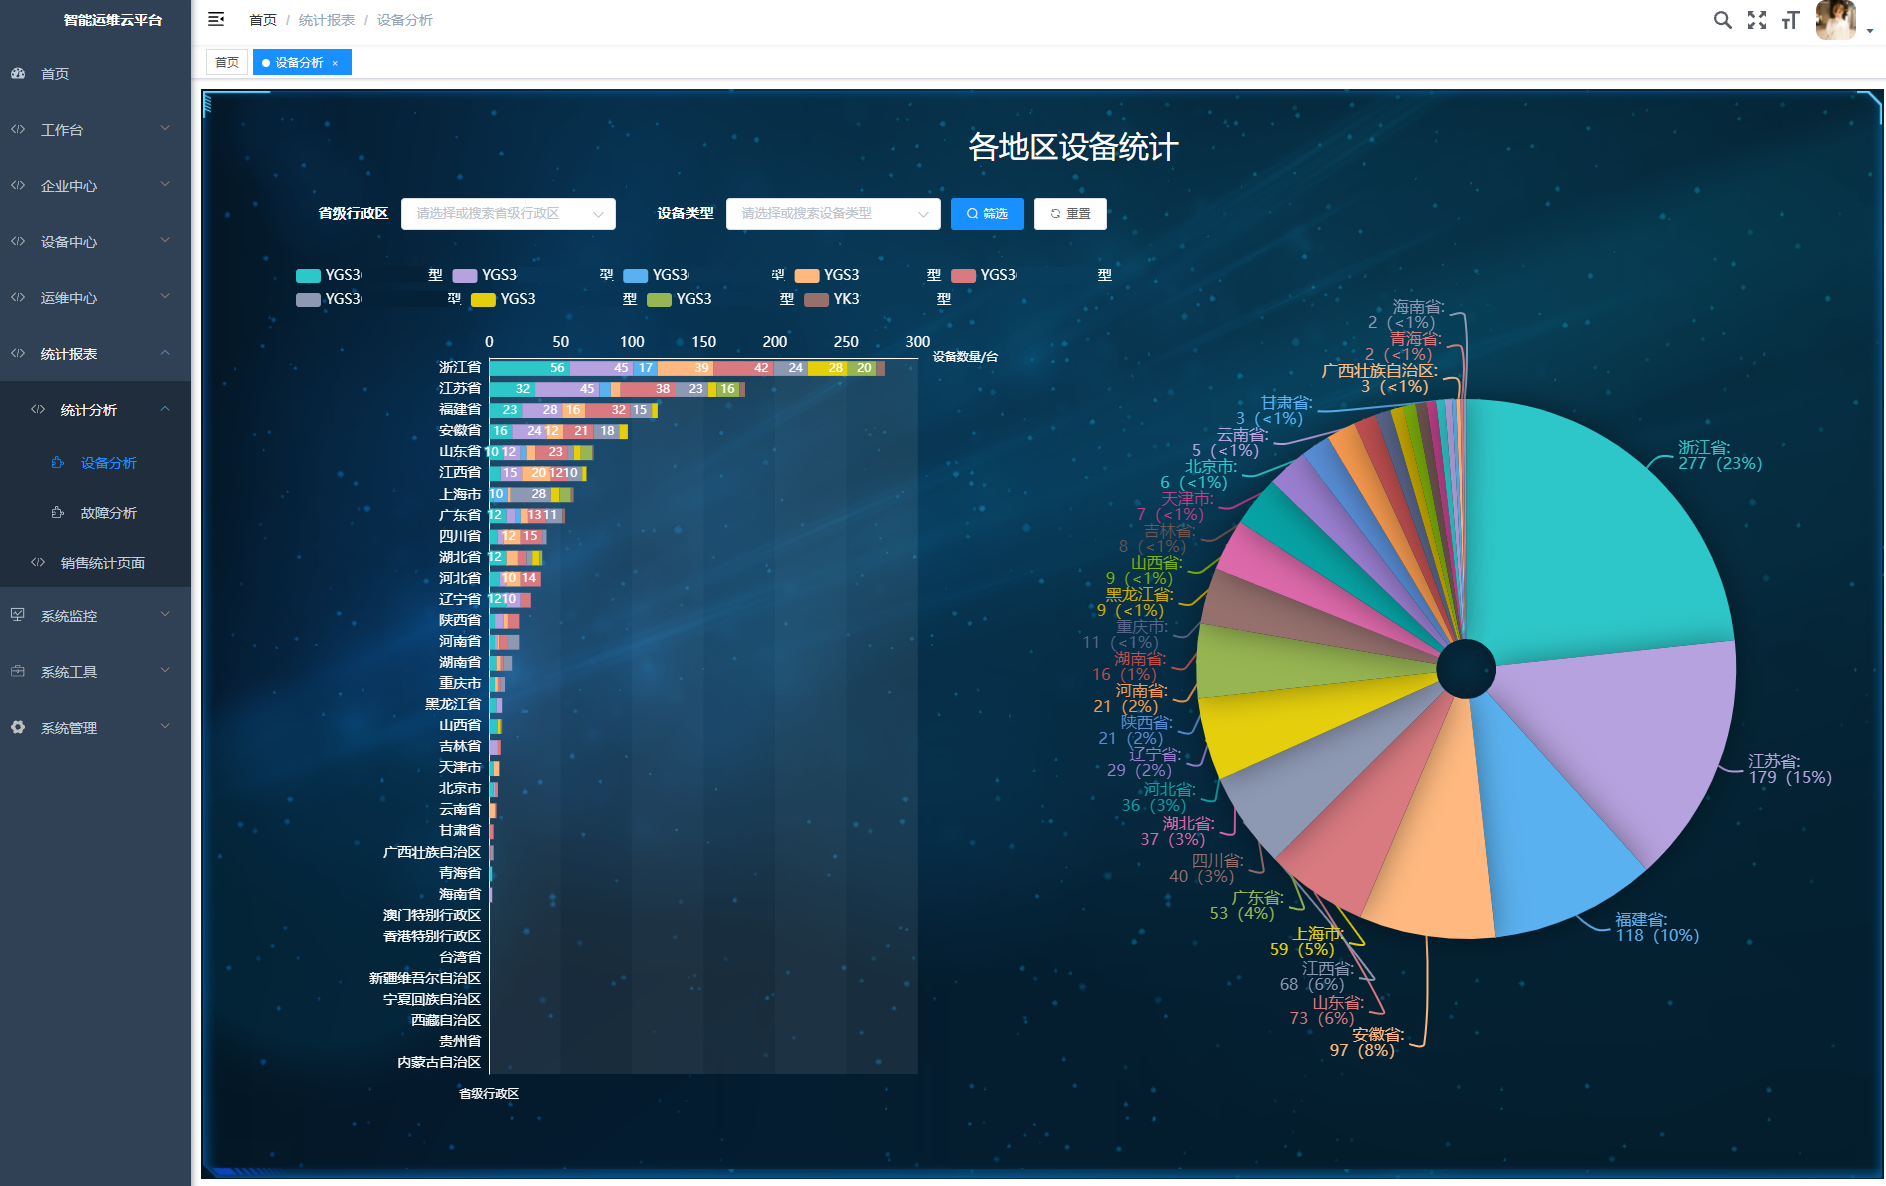
我负责【统计报表】-【统计分析】的【设备分析】部分,即分析公司在每个省份、每种设备类型各卖了多少。这个页面有两个图,分别是【各地区设备统计】和【设备销售类型销量分析】。由于没有从后端拿数据,数据在客户提供的 Excel 里,所以我这里将数据写死在前端。
4.1 各地区设备统计 这其实是一个图表,只是分成了左右两个图,左边是一个柱状堆积图,右边是一个饼图。
4.1.1 图表组件 为了更好地管理图表,我将所有的图表都写成了 Vue 组件(Component)的形式,而非写在当前页面。在当前页面导入组件,并注册组件使用它。
1 2 3 <div > <region_echart ref ="region" > </region_echart > </div >
1
2
3
4
5
6
7
import region_echart from "@/components/statisticalReport/echarts/region_echart" ;... export default { components : {region_echart, ...}, ... }
当父组件(页面)要使用子组件(图表)的数据时,例如父组件要调用子组件的函数,可以在子组件添加 ref 属性寻找它。
1 2 3 4 handleQuery ( this .$refs .region .getProvinceData (); },
当子组件(图表)要使用父组件(页面)的数据时,例如子组件想知道父组件的搜索框是什么条件,可以使用 this.$parent 向上寻找父组件。注意:由于 Vue 实际上可能套了好几层 div,所以要寻找好几层才能到目标父组件,可以在控制台 console.log 一下 this 及其父元素。
1
2
3
4
5
6
7
8
9
10
11
getProvinceData ( if (this .$parent .$parent .queryParams .provinces .length > 0 ) { this .provinceData = this .$parent .$parent .queryParams .provinces ; } else { this .provinceData = []; for (let province of regionData) { this .provinceData .push (province.label ); } } ... },
4.1.2 数据添加 这个表需要每个省份每种机床卖出了多少,因此我写在前端里的数据是一个大对象,属性是每个省份,每个省份的值又是一个对象,对应机床类型和销量。
1
2
3
4
5
data : { '北京市' : {'YGS3A...型' : 3 , 'YGS3B...型' : 1 , 'YGS3C...型' : 2 }, '上海市' : {'YGS3A...型' : 3 , 'YGS3B...型' : 10 , 'YGS3C...型' : 2 , ...}, ... },
首先我们拿到这些数据后,要处理成 Echarts 支持的数据形式。这里我们使用数组的形式。先添加数据:
1
2
3
4
5
6
7
8
9
10
11
12
13
14
15
16
17
18
19
20
21
22
23
24
25
26
27
28
29
30
31
32
33
34
35
36
37
38
39
40
41
42
43
44
45
46
47
getProvinceData ( if (this .$parent .$parent .queryParams .provinces .length > 0 ) { this .provinceData = this .$parent .$parent .queryParams .provinces ; } else { this .provinceData = []; for (let province of regionData) { this .provinceData .push (province.label ); } } ... }, getTypeData ( listType ().then (response => if (this .$parent .$parent .queryParams .deviceTypes .length > 0 ) { this .typeData = this .$parent .$parent .queryParams .deviceTypes ; } else { this .typeData = []; for (let type of response.rows ) { this .typeData .push (type.devicetypeName ); } } ... }); }, getDeviceNumber ( this .deviceNumber = {}; this .deviceNumber .total = []; for (let type of this .typeData ) { this .deviceNumber [type] = []; for (let province in this .provinceData ) { this .deviceNumber [type].push (0 ); } } for (let province in this .provinceData ) { this .deviceNumber .total .push (0 ); } for (let province in this .data ) { for (let type in this .data [province]) { if (this .provinceData .indexOf (province) > -1 && this .typeData .indexOf (type) > -1 ) { this .deviceNumber [type][this .provinceData .indexOf (province)] = this .data [province][type]; this .deviceNumber .total [this .provinceData .indexOf (province)] += this .data [province][type]; } } } console .log (this .deviceNumber ) ... },
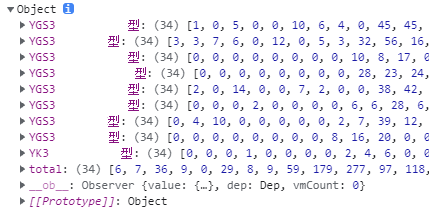
由于排序和饼图需要计算每个省份的设备总数,所以我们给 deviceNumber 对象加一个属性 total,其值为数组。provinceData 的顺序是确定的,它的索引对应 total 数组里和每个 type 数组里的索引。再根据已有数据,给对应类型的省份索引位置加数据,总数也要加数据,最终得到:
每个数组 34 个元素对应 34 个省级行政区,其中每个位置是哪个省由 provinceData 数组确定。
4.1.3 数据处理 以上数据还不能被图表使用,需要做进一步处理。
首先对于柱形图,我们需要让它按总数数量排序。Echarts 是不能做到这个功能的,所以我们需要处理数据源。
1
2
3
4
5
6
7
8
9
10
11
12
13
14
15
16
17
18
19
20
21
22
23
24
25
26
27
28
29
30
31
32
33
34
35
transformData ( let flag = 0 ; let flagData = []; for (let x = 0 ; x < this .deviceNumber .total .length ; x++) { flag = 0 ; for (let i = 0 ; i < this .deviceNumber .total .length ; i++) { if (this .deviceNumber .total [x] > this .deviceNumber .total [i]) { flag++; } } flagData.push (flag); } for (let x = 0 ; x < flagData.length ; x++) { flag = 0 ; for (let i = x + 1 ; i < flagData.length ; i++) { if (flagData[x] === flagData[i]) { flagData[i] += 1 ; } } } this .sortedDeviceNumber = { total : [] }; for (let type of this .typeData ) { this .sortedDeviceNumber [type] = [] } this .sortedProvinceData = []; for (let i in flagData) { for (let key in this .deviceNumber ) { this .sortedDeviceNumber [key][flagData[i]] = this .deviceNumber [key][i]; } this .sortedProvinceData [flagData[i]] = this .provinceData [i]; } ... },
以上代码 4-12 行,我们得到的 flagData 是由 34 个数字组成的数组,代表了每个省份的数量排序,即对于某个省份数量,有多少个省份数量比它小,那它就排多少位。13-20 行处理并列的省份,这样就得到了从小到大的省份新顺序。再根据这个新顺序,将数量与省份赋值到 sortedDeviceNumber 和 sortedProvinceData 里。柱形图就可以用这个数据了。
对于饼图,我们只需要省份和总数,注意总数为 0 时,将总数设置为 null,这样它就会被视为无效数据,不会出现在饼图上。
1
2
3
4
5
6
7
8
9
10
getPieData ( this .pieData = []; for (let i = this .sortedProvinceData .length - 1 ; i >= 0 ; i--) { this .pieData .push ({ name : this .sortedProvinceData [i], value : this .sortedDeviceNumber .total [i] === 0 ? null : this .sortedDeviceNumber .total [i], }) } ... },
4.1.4 柱形图和饼形图数据传入 这两个图属于一个图表,因此 Echarts 的 series 数量为 n+1,n 是设备类型数(表示柱形图),1 表示饼图。
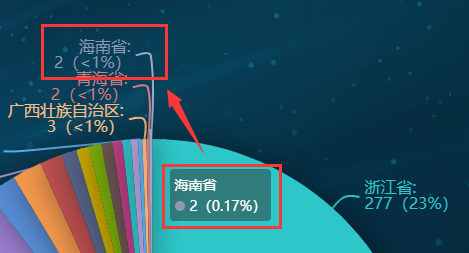
1
2
3
4
5
6
7
8
9
10
11
12
13
14
15
16
17
18
19
20
21
22
23
24
25
26
27
28
29
30
31
32
33
34
35
36
37
38
39
40
41
42
43
44
45
46
47
48
49
50
51
52
53
54
55
56
57
58
59
60
61
62
getSeries ( this .series = []; for (let type of this .typeData ) { this .series .push ({ name : type, type : 'bar' , stack : 'total' , label : { show : true , position : 'insideRight' , formatter : function (params ) { if (params.value < 10 ) { return '' ; } else { return params.value ; } } }, barCategoryGap : '30%' , data : this .sortedDeviceNumber [type], }); } this .series .push ({ type : 'pie' , radius : [30 , '60%' ], center : ['75%' , '45%' ], data : this .pieData , label : { fontSize : 16 , formatter : function (params ) { if (params.percent >= 1 ) { return params.name + ':\n' + params.value + '(' + Math .round (params.percent ) + '%)' ; } else { return params.name + ':\n' + params.value + '(<1%)' ; } } }, labelLine : { smooth : true , lineStyle : { width : 2 } }, tooltip : { trigger : 'item' , formatter : function (params ) { return params.name + '<br>' + params.marker + params.value + '(' + params.percent + '%)' ; } }, itemStyle : { shadowBlur : 30 , shadowColor : 'rgba(0, 0, 0, 0.4)' }, animationType : 'scale' , animationEasing : 'elasticOut' , animationDelay : function (idx ) { return Math .random () * 200 ; } }) ... },
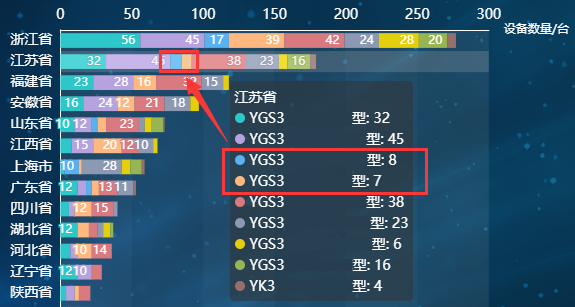
以上代码 11-16 行,当柱形图某个数据小于 10 时,则不显示标签数值,以免影响美观,或出现多个 0 重叠的情况。
以上代码 30-36 行,当饼图某个数据项占比小于 1% 时,就显示 <1%,以免被圆整为 0%。47-49 行,处理了饼图悬浮提示框的显示形式,用到了 params 即每个数据项的几个参数。
4.1.5 生成图表 生成图表用典型的 init 方法。
1 2 3 4 <template > <div style ="width: 100%; height: 900px" ref ="dev_chart" > </div > </template >
1
2
3
4
5
6
7
8
9
10
11
12
13
14
15
16
17
18
19
20
21
22
23
24
25
26
27
28
29
30
31
32
33
34
35
36
37
38
39
40
41
42
43
44
45
46
47
48
49
50
51
52
53
54
55
56
57
58
59
60
61
62
63
64
65
66
67
68
69
70
71
72
73
74
75
initEcharts ( this .chart = echarts.init (this .$refs .dev_chart , 'macarons' ); this .chart .setOption ({ tooltip : { trigger : 'axis' , axisPointer : { type : 'shadow' } }, legend : { data : this .typeData , textStyle : { color : '#fff' , fontSize : 14 }, left : '0%' , top : '0%' , width : '60%' }, grid : { left : '5%' , right : '60%' , top : '8%' , bottom : '10%' , containLabel : true , }, xAxis : { name : '设备数量/台' , type : 'value' , position : 'top' , splitLine : {show : false }, boundaryGap : [0 , 0.01 ], axisTick : { show : false }, axisLabel : { textStyle : { color : 'white' , fontSize : 14 } }, axisLine : { show : true , lineStyle : { color : '#fff' } }, }, yAxis : { name : '省级行政区' , nameLocation : 'start' , type : 'category' , data : this .sortedProvinceData , axisTick : { show : false }, splitLine : { show : false }, axisLabel : { textStyle : { color : '#fff' , fontSize : 14 } }, axisLine : { show : true , lineStyle : { color : '#fff' } }, }, series : this .series }, true ); }
注意以上代码第 2 行,如果要使用 macarons 主题,需要找到它的位置并导入。
1
2
import echarts from 'echarts' import "../../../../node_modules/echarts/theme/macarons" ;
4.1.6 解决获取不到属性的报错 之后的代码前端经常会报获取不到属性的错误,这甚至可能导致图表无法显示,为此有以下解决办法:
如果是在 Vue 部分直接使用对象的属性,可以先用 v-if 判断其是否存在。如以下代码,staticInfo 本来是个空对象,是在调用函数后才赋值,如果没有 v-if,函数调用延迟时,Vue 尝试填充此处的文本插值,就会报找不到 ncsId 属性的错。
1 <div class ="cell" v-if ="staticInfo.ncsId" > {{ staticInfo.ncsId }}</div >
使用函数内部调用下一个函数,以强行控制函数执行流程,确保获取数据,再操作数据,如:
1
2
3
4
5
6
7
8
9
10
11
12
13
14
15
created ( this .getList ; }, methods : { getList ( ListInfo ().then (response => ... this .handleData (); }); }, handleData ( ... }, ... }
将生成图表的函数放在 mounted 的 nextTick 里,或直接设置整个函数体位于 nextTick 里,如:
1
2
3
4
5
6
7
8
9
10
11
12
13
mounted ( this .$nextTick(() => { this .initEchart (); }); }, methods : { initEchart ( this .$nextTick(() => { let chart = echarts.init (this .$refs .dev_chart ); chart.setOption (this .options ); }); }, }
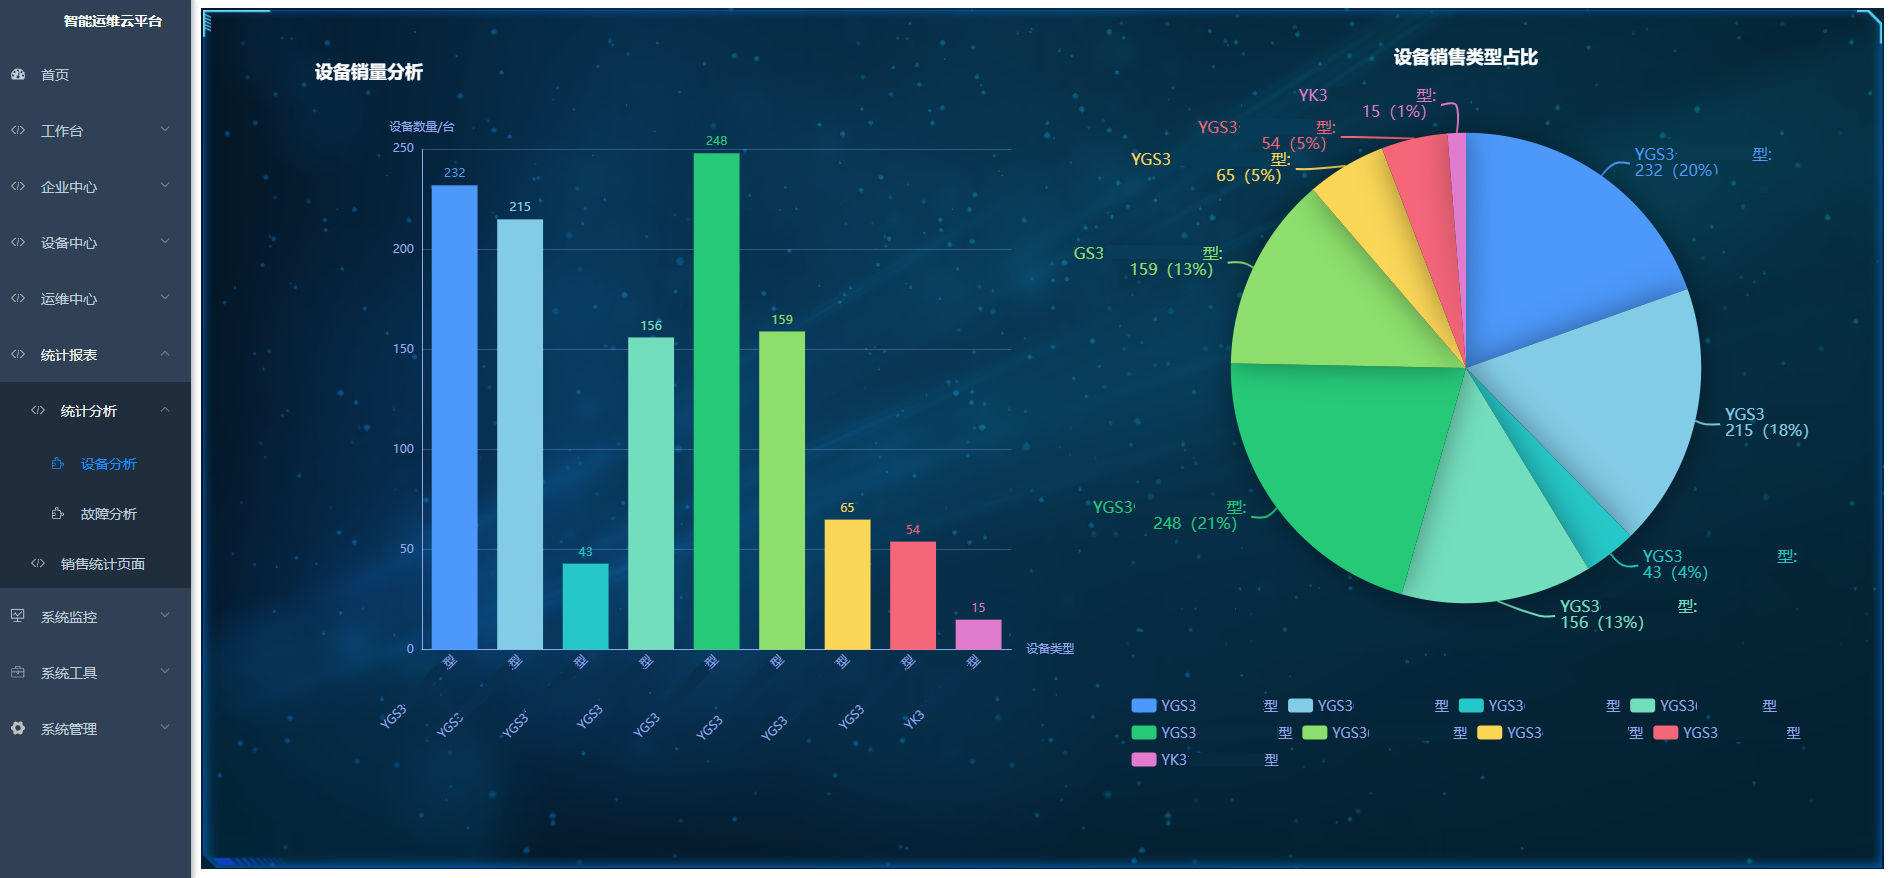
4.2 设备销售类型销量分析 这个图表是左右两张图,分别是柱形图和饼图,基本操作方法与之前类似。
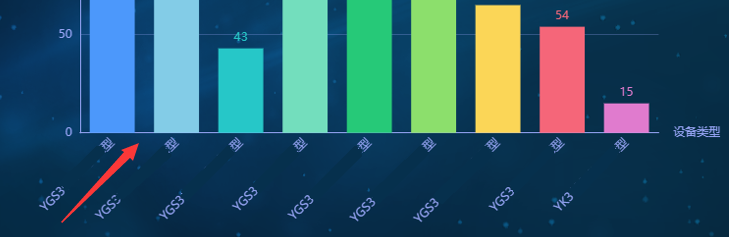
4.2.1 让柱形图同一系列显示不同的颜色 柱形图其实只有一个系列,即设备数量。但为了让每一个柱形显示不同颜色,就要加单独的 itemStyle。
1
2
3
4
5
6
7
8
9
10
11
12
13
14
15
16
17
18
19
20
21
22
23
24
25
getDeviceNumber ( let color= [ "#4C98FB" , "#83CCE7" , "#26C7C8" , "#73DEBD" , "#26C978" , "#8CDF6C" , "#FBD657" , "#F56679" , "#E07BCE" , "#9D50E0" , "#634FDA" ]; this .deviceNumber = []; for (let index in this .typeData ) { this .deviceNumber .push ({ value : this .data [index], itemStyle : { color : color[index] } }) } ... },
4.2.2 让柱形图横坐标标签旋转 45 度 横坐标标签过长,需要斜向放置,才能完整显示且更美观。
1
2
3
4
5
6
7
8
9
xAxis : { name : '设备类型' , type : "category" , axisLabel : { color : "#96A4F4" , rotate : 45 , }, ... }
饼图不用这么做,直接将 color 写在 option 里就好了,它会自动把不同颜色赋给不同的数据项。
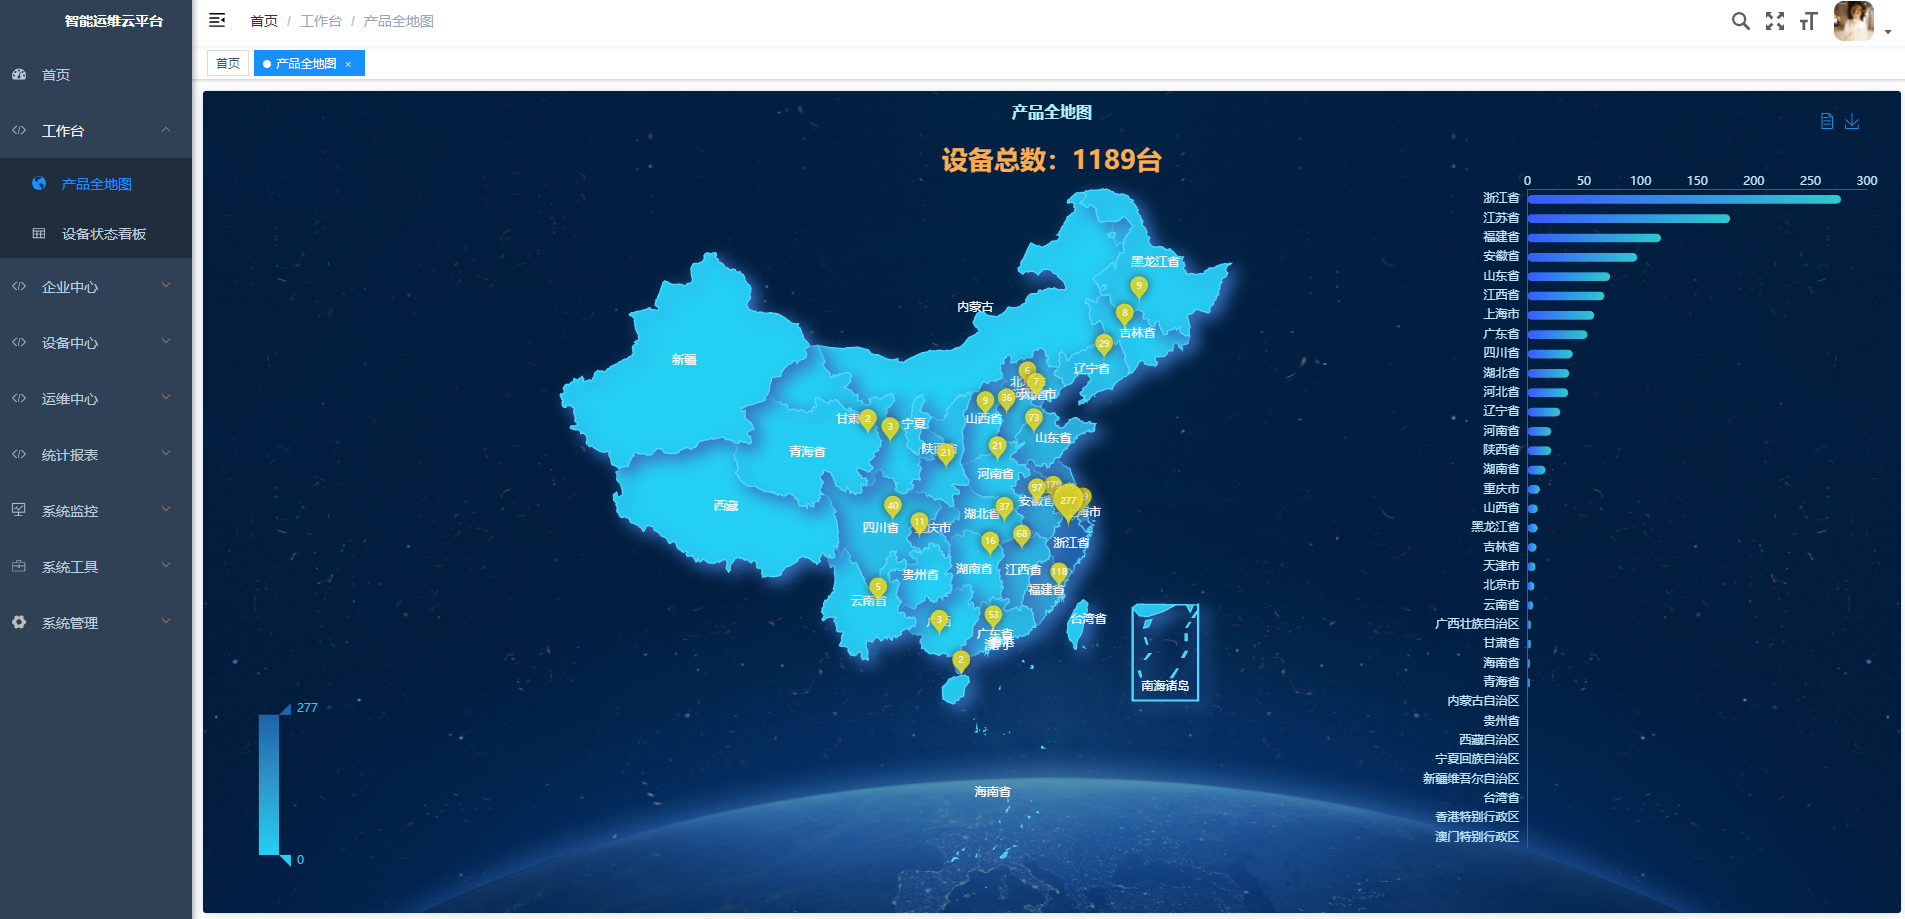
5 工作台 【工作台】是个类似于「大屏看板」的功能区,分为【产品全地图】和【设备状态看板】两个模块。
5.1 产品全地图 【产品全地图】其实就是把【统计报表】里的设备分析图换了个累加方式,按省份累加并且展示到全国地图里。这边的代码是昆山写的,我只是改了其中的数据,就不展开讲了。
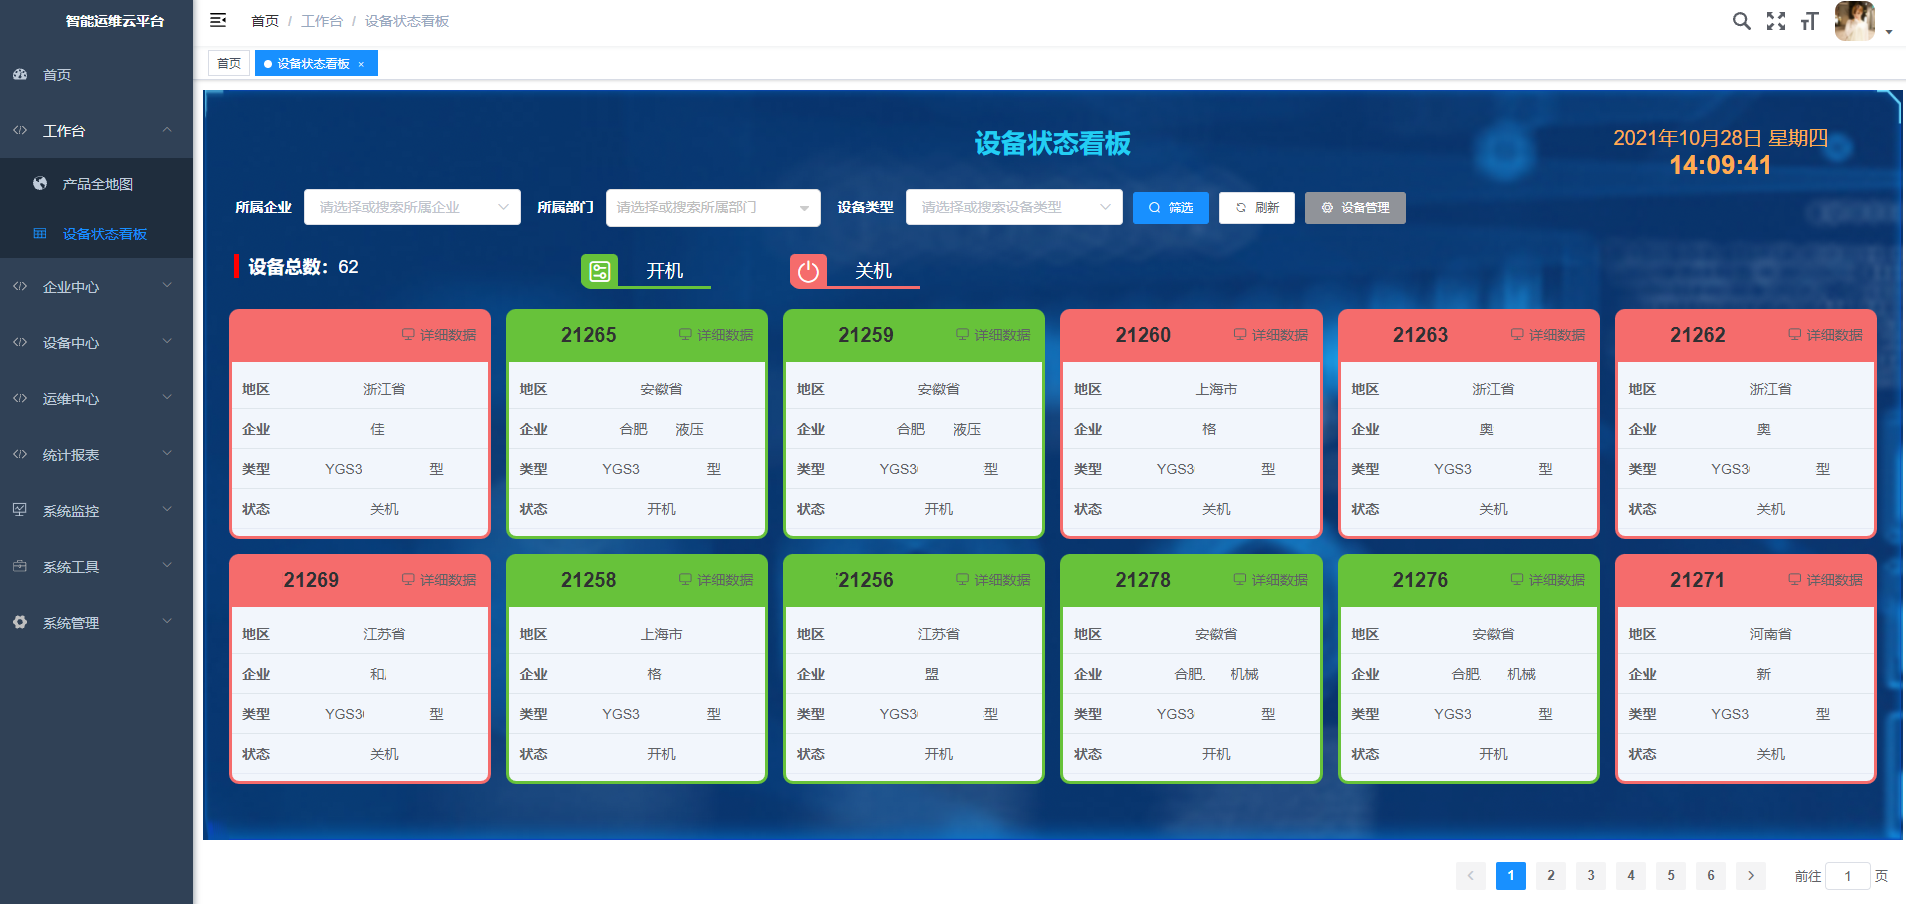
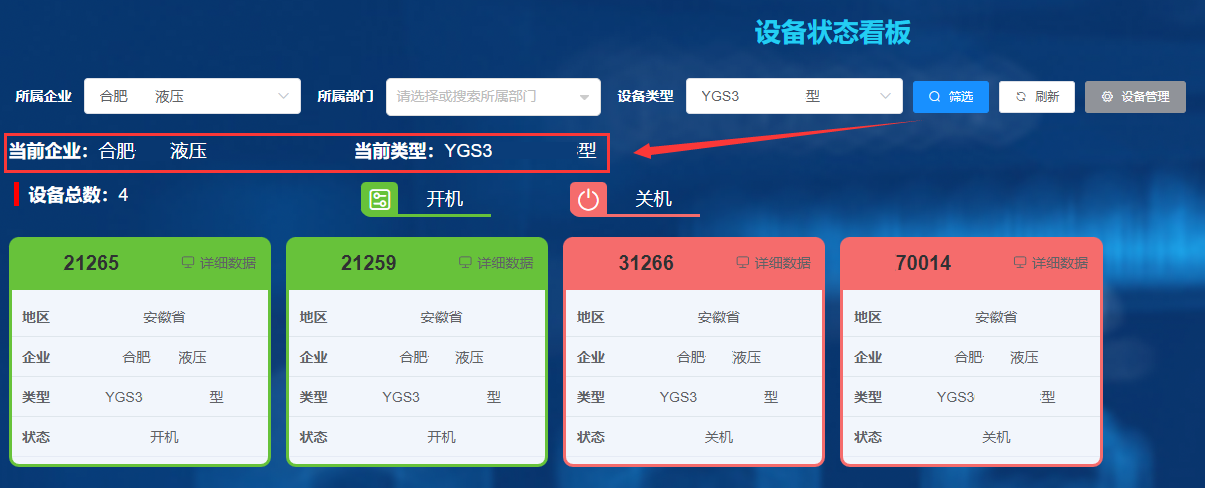
5.2 设备状态看板 【设备状态看板】展示了所有添加在【设备信息】里的设备,并根据采集到的数据展示它们的开关机状态,还可以点击每台设备右上角的按钮查看详细的监控数据。开关机状态所用的颜色来自 ElementUI 的调色板颜色 。
5.2.1 右上角的时间 看板右上角的时间可以通过 js 的定时器完成。先在 Vue 中为其占位,并设置好 CSS 样式。
1 2 3 4 <div class ="header_timer" > {{ nowDate }} {{ nowWeek }}<br > <span style ="font-size: 26px; font-weight: bold" > {{ nowTime }}</span > </div >
1
2
3
4
5
6
7
8
.header_timer { color : rgb (255 , 172 , 80 ); font-size : 20px ; font-weight : normal; position : absolute; top : 0% ; right : 3% ; }
定义一个函数,将当前时间写入变量:
1
2
3
4
5
6
7
8
9
10
11
12
13
14
15
16
17
18
19
20
21
22
23
24
25
26
27
28
29
30
31
32
33
setNowTimes ( let myDate = new Date (); let wk = myDate.getDay (); let yy = String (myDate.getFullYear ()); let mm = myDate.getMonth () + 1 ; let dd = String (myDate.getDate ()); let hou = String ( myDate.getHours () < 10 ? "0" + myDate.getHours () : myDate.getHours () ); let min = String ( myDate.getMinutes () < 10 ? "0" + myDate.getMinutes () : myDate.getMinutes () ); let sec = String ( myDate.getSeconds () < 10 ? "0" + myDate.getSeconds () : myDate.getSeconds () ); let weeks = [ "星期日" , "星期一" , "星期二" , "星期三" , "星期四" , "星期五" , "星期六" , ]; let week = weeks[wk]; this .nowDate = yy + "年" + mm + "月" + dd + "日" this .nowTime = hou + ":" + min + ":" + sec; this .nowWeek = week; }
再在 mounted 里设置一个定时器,设置为 1000 毫秒(即 1 秒)刷新一次就好,这样就实现了一个不断变化的时间。
1
2
3
4
5
mounted ( this .timer = setInterval (() => { this .setNowTimes (); }, 1000 ); },
5.2.2 搜索提示信息 客户要求,在上方搜索时,页面会提示它搜索的是什么企业或设备类型。这看起来是个很简单的工作,但着实费了我一阵功夫。
这个搜索功能和其他单表的搜索没有什么区别,都是获取 queryParams 然后调用 getList 函数。首先在页面的相关位置加上这三个提示的内容:
1 2 3 4 5 6 7 8 9 10 11 <el-row :gutter ="10" v-show ="isSearched" class ="white-text medium-text" style ="margin-bottom: 15px" > <el-col :lg ="5" :xs ="24" :sm ="8" > <span style ="font-weight: bold" v-show ="focusEnter !== null" > 当前企业:</span > {{ focusEnter }} </el-col > <el-col :lg ="5" :xs ="24" :sm ="8" > <span style ="font-weight: bold" v-show ="focusOrg !== null" > 当前部门:</span > {{ focusOrg }} </el-col > <el-col :lg ="5" :xs ="24" :sm ="8" > <span style ="font-weight: bold" v-show ="focusType !== null" > 当前类型:</span > {{ focusType }} </el-col > </el-row >
定义布尔变量 isSearched,判断是否在进行搜索,以及三个变量放搜索值。在搜索和重置搜索函数上,也要对这些变量进行处理:
1 2 3 4 5 6 7 8 9 10 11 12 13 14 15 16 17 18 19 20 handleQuery ( this .queryParams .pageNum = 1 ; this .getList (); this .getFocus (); if (this .focusEnter !== null || this .focusOrg !== null || this .focusType !== null ) { this .isSearched = true ; } else { this .isSearched = false ; } }, resetQuery ( this .resetForm ("queryForm" ); this .handleQuery (); this .isSearched = false ; this .focusEnter = null ; this .focusOrg = null ; this .focusType = null ; },
定义一个 getFocus 函数,用来把搜索值传给三个变量:
1
2
3
4
5
6
7
8
9
10
11
12
13
14
15
16
17
18
19
20
21
22
23
24
25
26
getFocus ( if (this .queryParams .enterpriseId !== null ) { for (let enter of this .enterOptions ) { if (enter.value === this .queryParams .enterpriseId ) { this .focusEnter = enter.label ; break ; } } } if (this .queryParams .orgId !== null ) { for (let org of this .orgOptionsList ) { if (org.value === this .queryParams .orgId ) { this .focusOrg = org.label ; break ; } } } if (this .queryParams .devicetypeId !== null ) { for (let type of this .typeOptions ) { if (type.value === this .queryParams .devicetypeId ) { this .focusType = type.label ; break ; } } } },
这个当时写的代码明显可以用 find 函数替代啊,大意了。
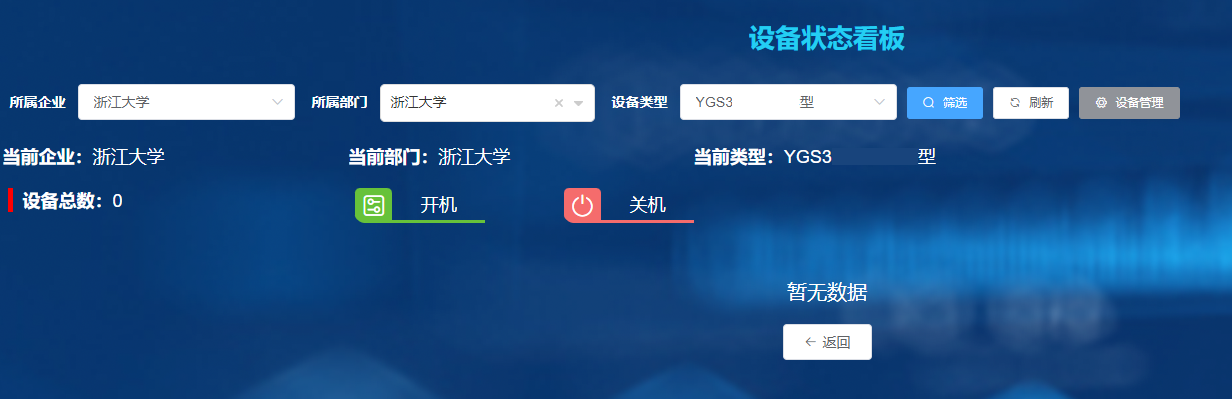
当设备总数为 0 时,其实也要设计一个整体的页面,返回按钮与重置按钮功能一致,调用同一个函数。
1 2 3 4 5 6 7 8 9 10 <div class ="device_container" style ="margin-top: 15px" > <div v-if ="total === 0" style ="margin: 50px auto; height: 200px; text-align: center" > <p style ="font-size: 20px; color: white" > 暂无数据</p > <el-button size ="medium" icon ="el-icon-back" @click ="resetQuery" > 返回</el-button > </div > <el-row :gutter ="15" v-else > ... </el-row > </div >
5.2.3 纯前端功底:图例和设备框的设计 这我是完全用 HTML+CSS 写的,真正考验前端功底。上代码:
1 2 3 4 5 6 7 8 9 10 11 12 13 14 15 16 17 18 19 20 21 22 23 24 25 26 27 28 29 30 31 32 33 34 35 36 37 38 39 40 41 42 43 44 45 46 47 48 49 50 51 52 53 54 55 56 57 58 59 60 61 62 63 64 65 66 67 68 69 70 71 72 73 74 75 <el-row :gutter ="20" class ="white-text medium-text" > <el-col :sm ="5" :xs ="24" > <div class ="legend-total" > <span style ="font-weight: bold" > 设备总数:</span > {{ total }} </div > </el-col > <el-col :lg ="3" :xs ="24" :sm ="6" :md ="4" > <div class ="legend-box" style ="border-bottom-color: #67C23A" > <div class ="legend-icon el-icon-set-up" style ="background-color: #67C23A" > </div > <div class ="legend-text" > 开机</div > </div > </el-col > <el-col :lg ="3" :xs ="24" :sm ="6" :md ="4" > <div class ="legend-box" style ="border-bottom-color: #F56C6C" > <div class ="legend-icon el-icon-switch-button" style ="background-color: #F56C6C" > </div > <div class ="legend-text" > 关机</div > </div > </el-col > </el-row > <div class ="device_container" style ="margin-top: 15px" > <div v-if ="total === 0" ... > ... </div > <el-row :gutter ="15" v-else > <el-col :xl ="4" :xs ="24" :sm ="12" :md ="8" :lg ="6" v-for ="item in deviceList" :key ="item.id" style ="margin-bottom: 15px" > <div class ="box-card" v-loading ="loading" > <div class ="card-header" :style ="{'background-color': dynamicCheckStatusList[item.ncsId] ? '#67C23A' : '#F56C6C'}" > <span class ="title" > {{ item.deviceName }}</span > <router-link :to ="`/status/device/` + item.id" > <el-link icon ="el-icon-monitor" :underline ="false" > 详细数据 </el-link > </router-link > </div > <div class ="card-main" :style ="{'border-color': dynamicCheckStatusList[item.ncsId] ? '#67C23A' : '#F56C6C'}" > <div class ="el-table el-table--enable-row-hover el-table--medium" > <table cellspacing ="0" style ="width: 100%" > <tbody > <tr > <td > <div class ="label" > 地区</div > </td > <td > <div v-if ="item.enterpriseId" > {{ enterOptions.find(enter => enter.value === item.enterpriseId) ? enterOptions.find(enter => enter.value === item.enterpriseId).province : '' }} </div > </td > </tr > ... <tr > <td > <div class ="label" > 状态</div > </td > <td > <div v-if ="dynamicCheckStatusList" > {{ dynamicCheckStatusList[item.ncsId] ? "开机" : "关机" }} </div > </td > </tr > </tbody > </table > </div > </div > </div > </el-col > </el-row >
以上代码第 29 行,使用 v-for 要绑定 key。
1
2
3
4
5
6
7
8
9
10
11
12
13
14
15
16
17
18
19
20
21
22
23
24
25
26
27
28
29
30
31
32
33
34
35
36
37
38
39
40
41
42
43
44
45
46
47
48
49
50
51
52
53
54
55
56
57
58
59
60
61
62
63
64
65
66
67
68
69
70
71
72
73
74
75
76
77
78
.white-text { color : white } .medium-text { font-size : 18px ; } .legend-total { border-left : 5px red solid; padding-left : 10px ; margin : 5px ; } .legend-box { border-bottom : 3px solid; height : 35px ; width : 130px ; display : flex; justify-content : space-between; align-items : center; border-radius : 0 0 0 10px ; margin : 5px ; } .legend-icon { height : 32px ; width : 40px ; font-size : 25px ; text-align : center; line-height : 35px ; border-radius : 5px 5px 0 5px ; } .legend-text { height : 32px ; width : 100px ; text-align : center; line-height : 35px ; } .card-header { display : flex; justify-content : space-between; align-items : center; padding : 5px 15px ; border-radius : 10px 10px 0 0 ; height : 50px ; } .title { position : relative; font-size : 20px ; color : #303133 ; font-weight : bold; } .card-main { background-color : #F2F6FC ; border : 3px solid; border-radius : 0 0 10px 10px ; height : 180px ; display : flex; justify-content : center; align-items : center; } td { background-color : #F2F6FC ; } td div { text-align : center; } .label { font-weight : bold; }
虽然现有的框架、组件非常好用,但要做出自己的效果还是需要靠 HTML+CSS 完成,这也让我体会到几十年前前端工程师的艰辛。
5.2.4 路由跳转 我们想让每台机床展现详细的监控数据,就做了一个按钮入口,这个实现方式有很多,比如 ElementUI 的 对话框 、弹出框 或 抽屉 等。最终我们决定做一个单独的页面展示机床数据。
每个机床应该共用一个页面模板,但数据需要有所不同,可以根据机床的 id 进行区分。这用的是若依的 路由跳转 。
在 router 的 index.js 里面,新配置一个路由:
1
2
3
4
5
6
7
8
9
10
11
12
13
{ path : '/status' , component : Layout , hidden : true , children : [ { path : 'device/:id(\\d+)' , component : (resolve ) => require (['@/views/staging/status/device' ], resolve), name : 'Device' , meta : { title : '设备详细数据' , icon : '' } } ] }
同时设置路由跳转:
1 2 3 4 5 <router-link :to ="`/status/device/` + item.id" > <el-link icon ="el-icon-monitor" :underline ="false" > 详细数据 </el-link > </router-link >
就可以跳转到指定的这个链接,链接所展示的页面是路由里 require 的页面,接下来编辑这个页面即可。
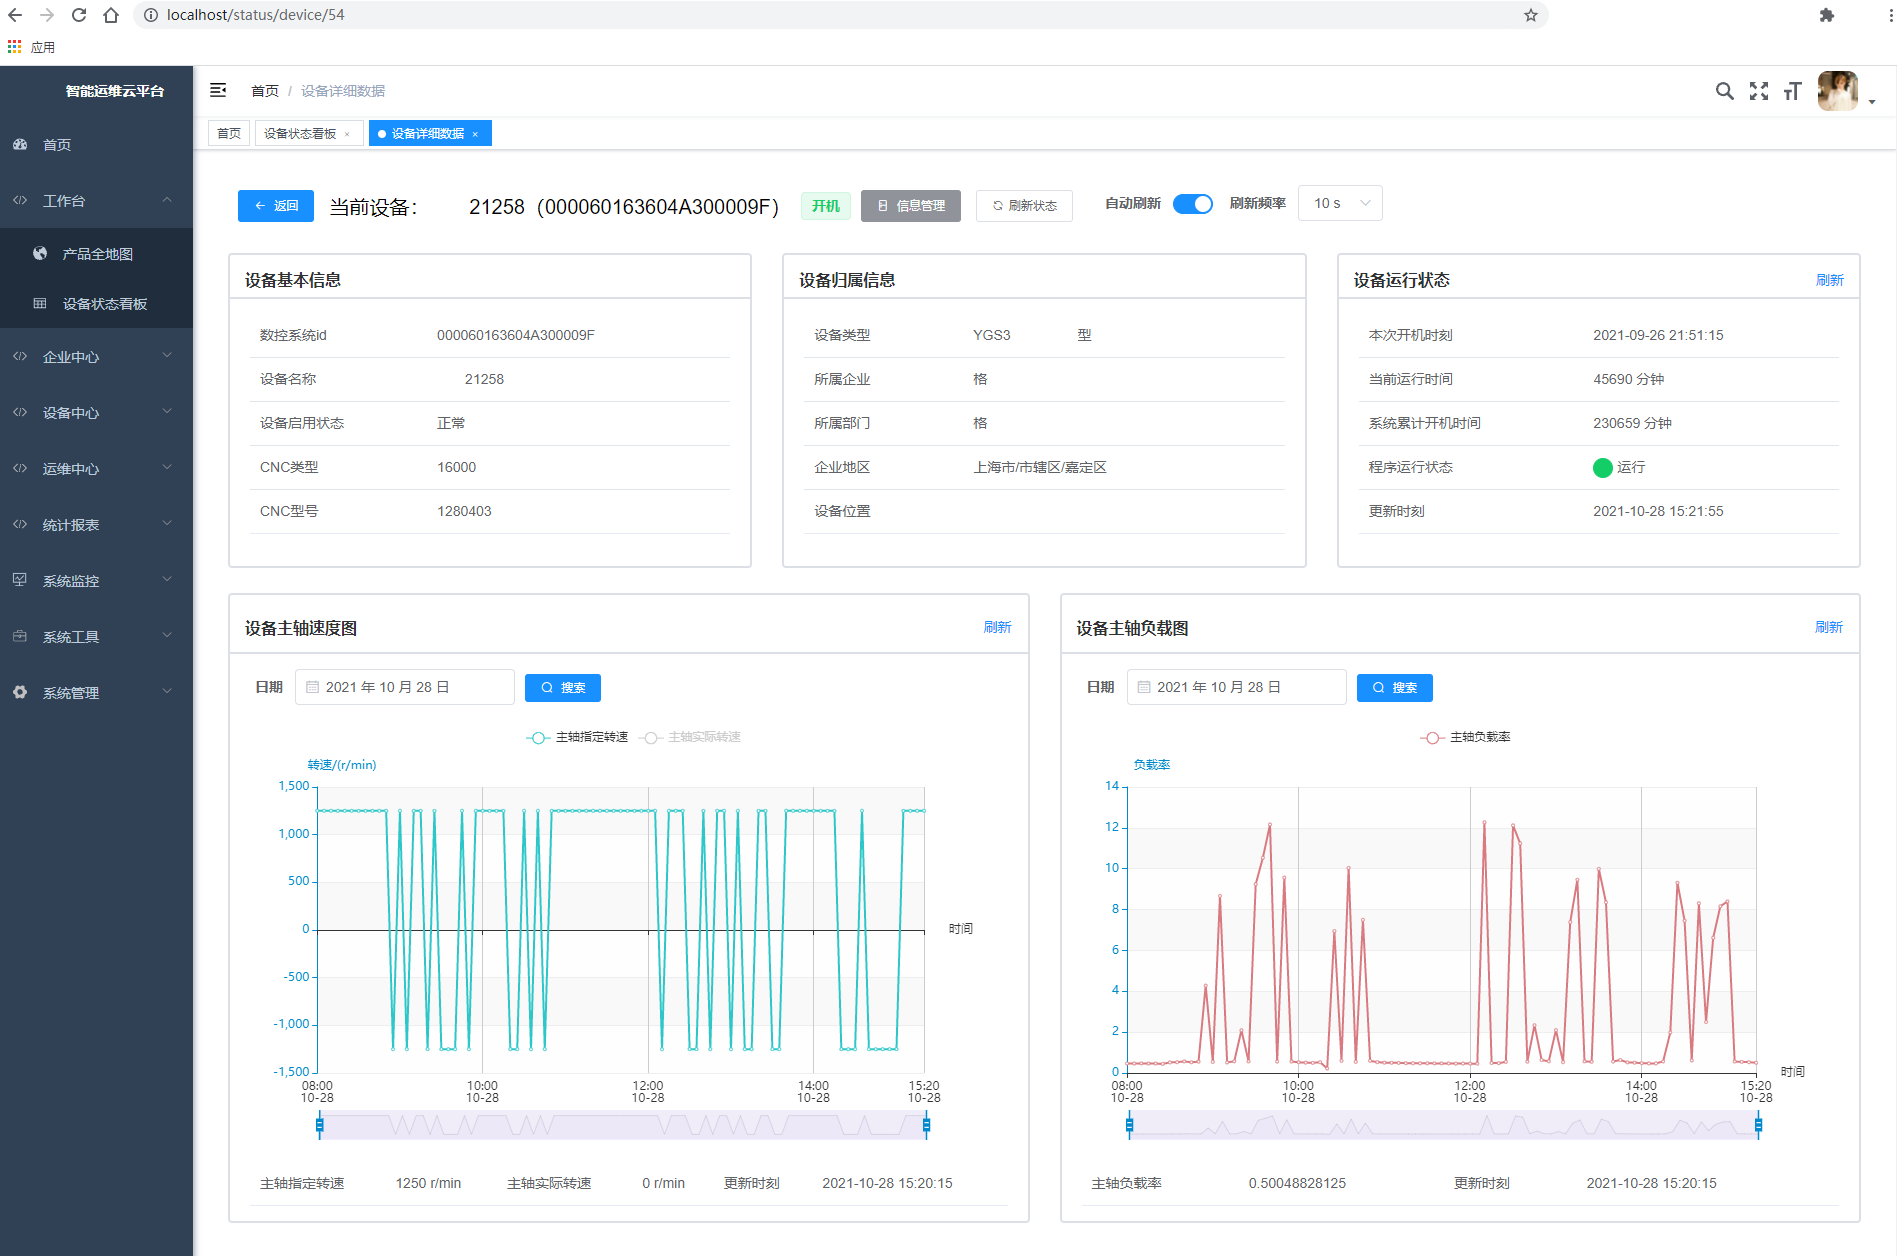
5.3 设备详细数据 这里展示每个机床的详细数据,不同的机床路径不同,数据不同。下图路径后的数字就是这台机床的 id。
5.3.1 机床 id 机床 id 是最核心的数据,不仅这个页面的路径需要机床 id,页面所有的数据也通过机床 id 拿到。所以在 Vue 的 data 里,就定义好机床 id。
1 deviceId : this .$route .params && this .$route .params .id ,
利用逻辑与的短路特性,如果获取到了 this.$route.param,就返回 id。
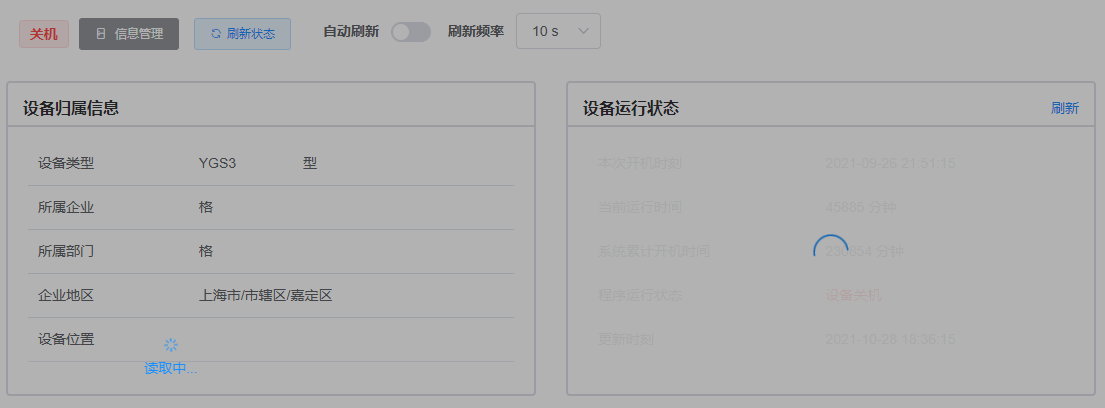
5.3.2 表格信息与变量绑定 所有的信息都是根据拿到的机床 id,然后使用后端的函数与前端的 api 查到的,包含静态数据(如设备归属信息)和动态数据(如设备运行状态)。特别要注意拿到的动态数据要看是否绑定,绑定的话还要显示用户自定义的名称和单位。
例如以下是设备基本信息的 Vue 代码:
1 2 3 4 5 6 7 8 9 10 11 12 13 14 15 16 17 18 19 20 21 22 23 24 25 26 27 28 29 30 31 32 33 34 35 36 37 38 39 40 41 42 43 44 45 46 47 48 49 50 51 52 53 54 55 56 57 58 59 60 61 62 63 64 65 66 <el-col :lg ="8" :md ="12" class ="card-box" > <el-card shadow ="hover" style ="margin-bottom: 15px; height: 315px" > <div slot ="header" class ="card-header" > <span style ="font-weight: bold" > 设备基本信息</span > </div > <div class ="el-table el-table--enable-row-hover el-table--medium" > <table cellspacing ="0" style ="width: 100%" > <tbody > <tr v-if ="this.showParam.hwProductSerialNrL" > <td > <div class ="cell" > {{ bindingParamInfo.find(item => item.mongoName === 'hwProductSerialNrL').paramName }} </div > </td > <td > <div class ="cell" v-if ="staticInfo.ncsId" > {{ staticInfo.ncsId }}</div > </td > </tr > <tr > <td > <div class ="cell" > 设备名称</div > </td > <td > <div class ="cell" v-if ="staticInfo.deviceName" > {{ staticInfo.deviceName }}</div > </td > </tr > <tr > <td > <div class ="cell" > 设备启用状态</div > </td > <td > <div class ="cell" v-if ="staticInfo.isStart !== null" > {{ staticInfo.isStart === 0 ? "正常" : "停用" }} </div > </td > </tr > <tr v-if ="this.showParam.nckType" > <td > <div class ="cell" > {{ bindingParamInfo.find(item => item.mongoName === 'nckType').paramName }}</div > </td > <td > <div class ="cell" v-if ="!isEmptyObject(dynamicTimeInfo)" > {{ dynamicTimeInfo.timePayLoad.nckType }} </div > <div class ="cell" v-else > (未找到)</div > </td > </tr > <tr v-if ="this.showParam.nckVersion" > <td > <div class ="cell" > {{ bindingParamInfo.find(item => item.mongoName === 'nckVersion').paramName }}</div > </td > <td > <div class ="cell" v-if ="!isEmptyObject(dynamicTimeInfo)" > {{ dynamicTimeInfo.timePayLoad.nckVersion }} </div > <div class ="cell" v-else > (未找到)</div > </td > </tr > </tbody > </table > </div > </el-card > </el-col >
再例如以下是设备运行状态的 Vue 代码:
1 2 3 4 5 6 7 8 9 10 11 12 13 14 15 16 17 18 19 20 21 22 23 24 25 26 27 28 29 30 31 32 33 34 35 36 37 38 39 40 41 42 43 44 45 46 47 48 49 50 51 52 53 54 55 56 57 58 59 60 61 62 63 64 65 66 67 68 69 70 71 72 73 74 75 76 77 78 79 80 81 82 83 84 85 86 87 <el-col :lg ="8" :md ="24" class ="card-box" > <el-card shadow ="hover" style ="margin-bottom: 15px; height: 315px" > <div slot ="header" class ="card-header" > <span style ="font-weight: bold" > 设备运行状态</span > <el-link type ="primary" :underline ="false" @click ="handleDynamicRefresh" > 刷新 </el-link > </div > <div class ="el-table el-table--enable-row-hover el-table--medium" > <table cellspacing ="0" style ="width: 100%" v-loading ="tableLoading" > <tbody v-if ="!isEmptyObject(dynamicTimeInfo) || !isEmptyObject(dynamicProgStatus)" > <tr > <td > <div class ="cell" > 本次开机时刻</div > </td > <td > <div class ="cell" v-if ="dynamicTimeInfo" > {{ dynamicTimeInfo.todayStartTime }}</div > </td > </tr > <tr v-if ="this.showParam.poweronTime" > <td > <div class ="cell" > {{ bindingParamInfo.find(item => item.mongoName === 'poweronTime').paramName }} </div > </td > <td > <div class ="cell" v-if ="dynamicTimeInfo" > {{ dynamicTimeInfo.timePayLoad.poweronTime }} {{ bindingParamInfo.find(item => item.mongoName === 'poweronTime').paramUnit }} </div > </td > </tr > <tr v-if ="this.showParam.setupTime" > <td > <div class ="cell" > {{ bindingParamInfo.find(item => item.mongoName === 'setupTime').paramName }}</div > </td > <td > <div class ="cell" v-if ="dynamicTimeInfo" > {{ dynamicTimeInfo.timePayLoad.setupTime }} {{ bindingParamInfo.find(item => item.mongoName === 'setupTime').paramUnit }} </div > </td > </tr > <tr v-if ="this.showParam.progStatus" > <td > <div class ="cell" > {{ bindingParamInfo.find(item => item.mongoName === 'progStatus').paramName }}</div > </td > <td > <div class ="cell" v-if ="dynamicCheckStatus && dynamicProgStatus.progStatus" > <el-button circle type ="danger" size ="small" style ="vertical-align: middle" v-if ="[1,2,5].indexOf(dynamicProgStatus.progStatus) > -1" > </el-button > <el-button circle type ="success" size ="small" style ="vertical-align: middle" v-else-if ="dynamicProgStatus.progStatus === 3" > </el-button > <el-button circle type ="warning" size ="small" style ="vertical-align: middle" v-else-if ="dynamicProgStatus.progStatus === 4" > </el-button > {{ dynamicProgStatus.string }} </div > <div class ="cell" v-else-if ="!dynamicCheckStatus" style ="color: red" > 设备关机 </div > </td > </tr > <tr v-if ="this.showParam.progStatus" > <td > <div class ="cell" > 更新时刻</div > </td > <td > <div class ="cell" v-if ="dynamicProgStatus.time" > {{ dynamicProgStatus.time }}</div > </td > </tr > </tbody > <tbody v-else > <tr > <td > <div class ="cell" > 未找到设备运行状态,请<router-link :to ="`../../deviceCenter/device`" > <el-link type ="primary" :underline ="false" > 检查数控系统id</el-link > </router-link > 或联系技术人员 </div > </td > </tr > </tbody > </table > </div > </el-card > </el-col >
这里首先拿到对象时要判断其是否为空对象,因为 空对象在 JavaScript 中被视为 true 。这里我用的是自定义函数:
1 2 3 4 5 6 7 isEmptyObject (obj ) { for (let key in obj) { return false ; } return true ; },
(JavaScript 中,undefined、null、-0、0(+0)、NaN、''(空字符串)都被视为 false,其他都被视为 true,如空数组 [] 和空对象 {} 也被视为 true)
然后,我们会拿到一些机床数据,例如 dynamicTimeInfo、dynamicProgStatus 对象。为了实现变量绑定,我们还需要拿到:用户自定义的所有变量(从【变量信息】里拿),用户绑定到这台机床类型的变量(从绑定表里拿)。我用以下方式获取与处理变量:
1 2 3 4 5 6 7 8 9 10 11 12 13 14 15 16 17 18 19 20 21 22 23 24 25 26 27 28 29 30 31 32 33 34 35 36 37 38 39 40 41 42 43 getParams ( listParam ().then (response => this .params = response.rows ; this .getMongos (); }) }, getMongos ( listMongoVariable ().then (response => this .mongos = response.rows ; this .getBindings (); }) }, getBindings ( listDevicetypeparam ().then (response => this .bindings = response.rows ; this .getBindingParamInfo (); }) }, getBindingParamInfo ( this .bindingParamInfo = []; for (let item of this .bindings ) { if (this .devicetypeId === item.devicetypeId ) { this .bindingParamInfo .push ({ paramId : item.paramId }) } } for (let bindingParam of this .bindingParamInfo ) { bindingParam.paramName = this .params .find (param =>id === bindingParam.paramId ).paramName ; bindingParam.paramUnit = this .params .find (param =>id === bindingParam.paramId ).paramUnit ; bindingParam.mongoId = this .params .find (param =>id === bindingParam.paramId ).mongoId ; bindingParam.mongoName = this .mongos .find (mongo =>id === bindingParam.mongoId ).mongoName ; } this .showParam = {}; for (let mongo of this .mongos ) { this .showParam [mongo.mongoName ] = false ; if (this .bindingParamInfo .find (item =>mongoName === mongo.mongoName )) { this .showParam [mongo.mongoName ] = true ; } } this .loading .close (); },
getParams 函数拿所有的自定义变量,getMongos 函数拿所有的 MongoDB 变量,getBindings 函数拿所有的绑定关系,getBindingParamInfo 函数先把为当前类型绑定的变量放进数组里,再通过之前拿的信息为这些变量一一补充信息(如名称、单位等),最后在一个 showParam 数组里,为每个 MongoDB 变量设置布尔值,方便 Vue 里的 v-if 使用。
5.3.3 主轴信息图表:日期信息通信 下面两个图表结构基本一致,所要实现的功能和要处理的数据也基本一致。这两个图表我也是写在组件里的。
首先是这个日期搜索功能,其实也属于父组件和子组件的通信。以下是父组件的前端部分:
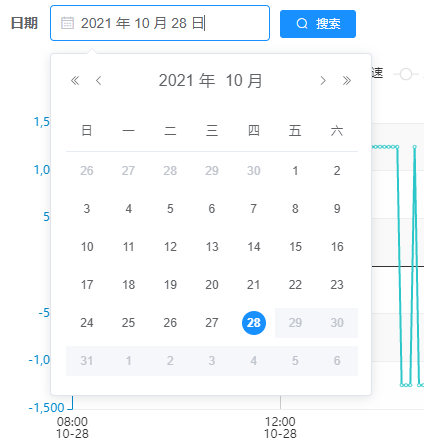
1 2 3 4 5 6 7 8 9 10 11 12 13 14 15 16 17 18 19 20 21 22 <el-form :model ="speedDate" label-width ="45px" :inline ="true" > <el-form-item label ="日期" > <el-date-picker v-model ="speedDate.date" type ="date" placeholder ="请选择日期" format ="yyyy 年 MM 月 dd 日" value-format ="timestamp" :clearable ="false" :picker-options ="pickerOptions" > </el-date-picker > </el-form-item > <el-form-item > <el-button type ="primary" icon ="el-icon-search" size ="mini" @click ="handleSpeedQuery" > 搜索 </el-button > </el-form-item > <el-form-item v-if ="$refs.speed && isEmptyObject($refs.speed.dynamicSpindleInfoList)" > <div > 系统当日无数据</div > </el-form-item > </el-form >
1 2 3 4 5 6 7 8 9 10 11 12 13 14 15 speedDate : {date : new Date (new Date ().toLocaleDateString ()).getTime ()}, ... pickerOptions : { disabledDate (time ) { return time.getTime () > Date .now () - 8.64e6 } }, ... handleSpeedQuery ( this .speedLoading = true ; this .getDynamicSpindleInfo (); this .$refs .speed .getNcsId (); },
子组件要拿这个日期去查询信息:
1 2 3 4 5 6 7 8 9 10 11 12 13 14 15 16 17 18 getNcsId ( getDevice (this .deviceId ).then (response => this .deviceNcsId = response.data .ncsId ; this .devicetypeId = response.data .devicetypeId ; this .getDynamicSpindleInfoList (); }) }, getDynamicSpindleInfoList ( listSpindleDocByTime (this .deviceNcsId , this .$parent .$parent .$parent .$parent .speedDate .date ).then (response => this .dynamicSpindleInfoList = []; for (let doc of response) { this .dynamicSpindleInfoList .push (doc); } ... }); },
这样子组件就拿到了某个日期的主轴信息列表,并拿此去画图。
5.3.4 主轴信息图表:父组件的信息展示与变量绑定 图表的下方有一个表格,这个表格位于父组件,展示读取到的最新的主轴动态数据。这个表格的处理很复杂,不仅要考虑到变量绑定,也要考虑到适配。
1 2 3 4 5 6 7 8 9 10 11 12 13 14 15 16 17 18 19 20 21 22 23 24 25 26 27 28 29 30 31 32 33 34 35 36 37 38 39 40 41 42 43 44 45 46 47 48 49 50 51 52 53 54 55 56 57 58 59 60 61 62 63 64 65 66 67 68 69 <el-card shadow ="hover" style ="margin-bottom: 15px; height: 630px" > <div slot ="header" class ="card-header" > <span style ="font-weight: bold" > 设备主轴速度图</span > <el-button class ="button" type ="text" @click ="handleSpeedRefresh" > 刷新 </el-button > </div > <div > <el-form :model ="speedDate" label-width ="45px" :inline ="true" > ... </el-form > <div v-loading ="speedLoading" > <spindle_speed ref ="speed" > </spindle_speed > </div > <div class ="el-table el-table--enable-row-hover el-table--medium" style ="margin-top: 15px" > <table cellspacing ="0" style ="width: 100%" > <tbody v-if ="!isEmptyObject(dynamicSpindleInfo) && screenWidth >= 992" > <tr v-if ="this.showParam.cmdSpeed || this.showParam.actSpeed" > <td v-if ="this.showParam.cmdSpeed" > <div class ="cell" > {{ bindingParamInfo.find(item => item.mongoName === 'cmdSpeed').paramName }}</div > </td > <td v-if ="this.showParam.cmdSpeed" > <div class ="cell" v-if ="this.dynamicSpindleInfo.spindlePayLoad.cmdSpeed !== null" > {{ dynamicSpindleInfo.spindlePayLoad.cmdSpeed }} {{ bindingParamInfo.find(item => item.mongoName === 'cmdSpeed').paramUnit }} </div > </td > <td v-if ="this.showParam.actSpeed" > <div class ="cell" > {{ bindingParamInfo.find(item => item.mongoName === 'actSpeed').paramName }}</div > </td > <td v-if ="this.showParam.actSpeed" > <div class ="cell" v-if ="this.dynamicSpindleInfo.spindlePayLoad.actSpeed !== null" > {{ dynamicSpindleInfo.spindlePayLoad.actSpeed }} {{ bindingParamInfo.find(item => item.mongoName === 'actSpeed').paramUnit }} </div > </td > <td > <div class ="cell" > 更新时刻</div > </td > <td > <div class ="cell" v-if ="this.dynamicSpindleInfo.time" > {{ dynamicSpindleInfo.time }}</div > </td > </tr > <tr v-else > <div class ="cell" > 您可能未绑定速度相关变量, <router-link :to ="`../../deviceCenter/type`" > <el-link type ="primary" :underline ="false" > 点击绑定</el-link > </router-link > </div > </tr > </tbody > <tbody v-else-if ="screenWidth >= 350" > ... </tbody > <tbody v-else-if ="screenWidth < 350" > ... </tbody > <tbody v-if ="isEmptyObject(dynamicSpindleInfo)" > <tr > <div class ="cell" > 未找到最新主轴速度信息。 </div > </tr > </tbody > </table > </div > </div > </el-card >
屏幕的宽度提前写在 data 里:
1 screenWidth : document .body .clientWidth
5.3.5 主轴信息图表:子组件的图表展示与变量绑定 变量绑定关系到图表的数据源,绑定就给图表数据,不绑定就不给,所以子组件最好也提前判断好是否绑定要画的变量。
1 2 3 4 5 6 7 8 9 10 11 12 13 14 15 16 17 18 19 20 21 22 23 24 findMongoId ( listMongoVariable ().then (response => this .mongoId .cmdSpeed = response.rows .find (row =>mongoName === 'cmdSpeed' ).id ; this .mongoId .actSpeed = response.rows .find (row =>mongoName === 'actSpeed' ).id ; this .findParamId (); }) }, findParamId ( listParam ().then (response => this .paramId .cmdSpeed = response.rows .find (row =>mongoId === this .mongoId .cmdSpeed ).id ; this .paramId .actSpeed = response.rows .find (row =>mongoId === this .mongoId .actSpeed ).id ; this .paramName .cmdSpeed = response.rows .find (row =>mongoId === this .mongoId .cmdSpeed ).paramName ; this .paramName .actSpeed = response.rows .find (row =>mongoId === this .mongoId .actSpeed ).paramName ; this .findWhetherBound (); }) }, findWhetherBound ( listDevicetypeparam ().then (response => this .isBound .cmdSpeed = !!response.rows .find (row =>devicetypeId === this .devicetypeId && row.paramId === this .paramId .cmdSpeed ); this .isBound .actSpeed = !!response.rows .find (row =>devicetypeId === this .devicetypeId && row.paramId === this .paramId .actSpeed ); ... }) },
这样通过 isBound 这个对象,就知道 cmdSpeed 和 actSpeed 绑定与否。
再将数据处理为 Echarts 接受的形式(拿了所有数据):
1
2
3
4
5
6
7
8
9
10
11
getSpeedDatasetSource ( this .speedDatasetSource = []; for (let info of this .dynamicSpindleInfoList ) { this .speedDatasetSource .push ({ time : info.time , cmdSpeed : info.spindlePayLoad .cmdSpeed , actSpeed : info.spindlePayLoad .actSpeed }); } ... },
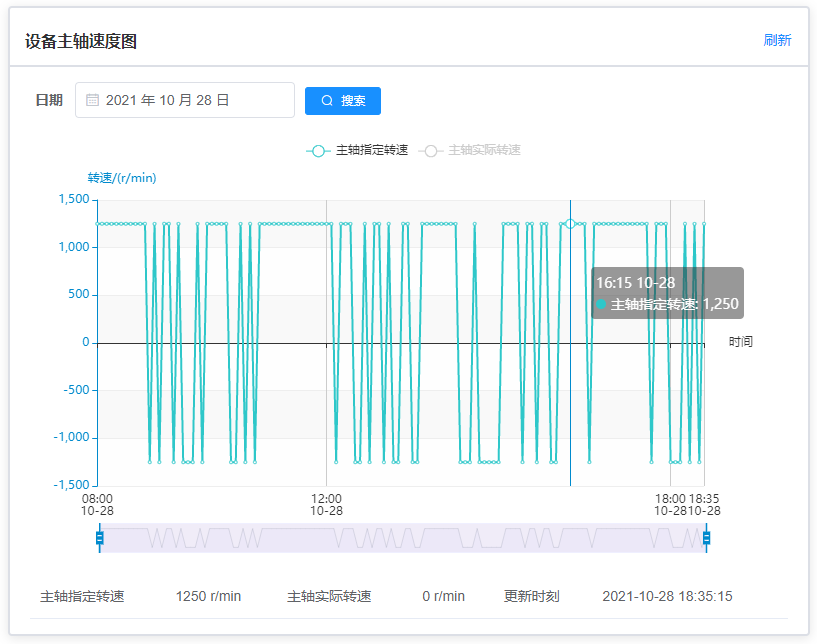
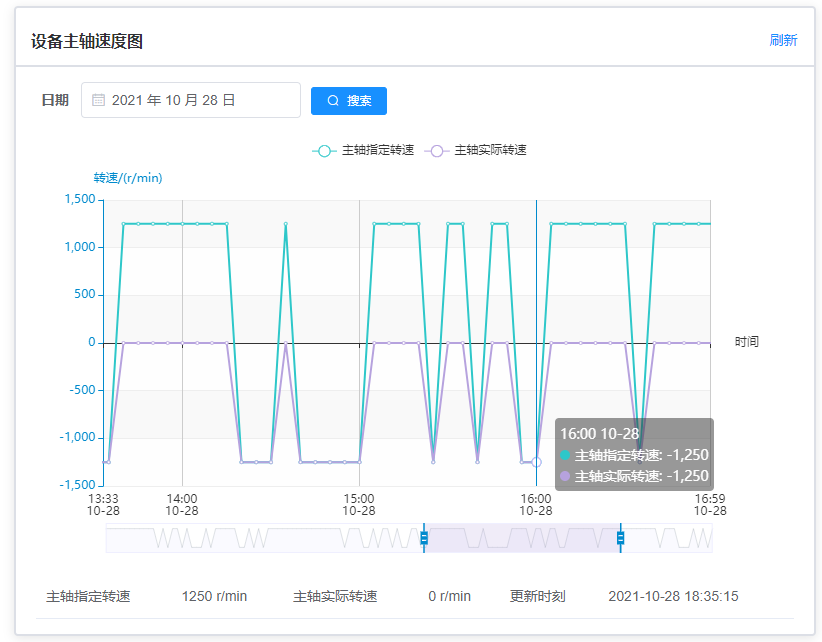
最后初始化图表。客户要求默认只显示主轴指定转速(cmdSpeed),不显示主轴实际转速(actSpeed),这在 Echarts 中可以用 selected 属性设置。
1 2 3 4 5 6 7 8 9 10 11 12 13 14 15 16 17 18 19 20 21 22 23 24 25 26 27 28 29 30 31 32 33 34 35 36 37 38 39 40 41 42 43 44 45 46 47 48 49 50 51 52 53 54 55 56 57 58 59 60 61 62 63 64 65 66 67 68 69 70 71 72 73 74 75 76 77 78 79 80 81 82 83 getSpeedGraph ( let selected = {}; if (this .isBound .cmdSpeed ) { selected[this .paramName .cmdSpeed ] = true ; selected[this .paramName .actSpeed ] = false ; } else { selected[this .paramName .actSpeed ] = true ; } this .speedGraph = echarts.init (this .$refs .speed_chart , "macarons" ); this .speedGraph .setOption ({ tooltip : { trigger : 'axis' , axisPointer : { type : 'line' , snap : true } }, legend : { data : [this .paramName .cmdSpeed , this .paramName .actSpeed ], selected : selected }, grid : { left : '3%' , right : '12%' , bottom : '10%' , containLabel : true , }, dataset : { dimensions : [{name : 'time' , type : 'time' }, 'cmdSpeed' , 'actSpeed' ], source : this .speedDatasetSource }, xAxis : { name : '时间' , nameTextStyle : { padding : [0 , 0 , 0 , 10 ] }, type : 'time' }, yAxis : { name : '转速/(r/min)' , type : 'value' , nameTextStyle : { padding : [0 , 0 , 0 , 50 ] } }, dataZoom : [{ type : 'slider' , start : 0 , end : 100 , xAxisIndex : 0 , filterMode : 'none' }, { type : 'inside' , start : 0 , end : 100 , xAxisIndex : 0 , filterMode : 'none' }], series : [ this .isBound .cmdSpeed ? { name : this .paramName .cmdSpeed , type : 'line' , encode : { x : 0 , y : 1 }, smooth : false } : null , this .isBound .actSpeed ? { name : this .paramName .actSpeed , type : 'line' , encode : { x : 0 , y : 2 }, smooth : false } : null ] }, true ); this .$parent .$parent .$parent .$parent .speedLoading = false ; }
最终效果如下:
5.3.6 普通刷新 整个设备详细数据一共有 4 个普通刷新,分别是最上面的白色按钮「刷新状态」,以及 3 个动态数据卡片右上角的蓝色「刷新」文字。
刷新操作只要将按钮绑定到一个刷新函数就好了,函数内再调用重置相关信息或获得相关信息的函数,以实现数据刷新。这里我还写了几个 loading 变量,并将它们 v-loading 绑定到相关标签上,并在刷新时设置为 true,获取完毕数据后设置为 false,这样就可以实现加载功能。
1 2 3 4 5 6 7 8 9 10 11 12 13 14 15 16 17 18 19 20 21 22 23 24 25 26 handleGlobalRefresh ( this .openLoading (); this .speedLoading = true ; this .tableLoading = true ; this .driveLoading = true ; this .getBasicInfo (); this .$refs .speed .getNcsId (); this .$refs .drive .getNcsId (); }, handleDynamicRefresh ( this .tableLoading = true ; this .getDynamicTimeInfo (); }, handleSpeedRefresh ( this .speedLoading = true ; this .speedDate .date = new Date (new Date ().toLocaleDateString ()).getTime (); this .getDynamicSpindleInfo (); this .$refs .speed .getNcsId (); }, handleDriveRefresh ( this .driveLoading = true ; this .driveDate .date = new Date (new Date ().toLocaleDateString ()).getTime (); this .getDynamicSpindleInfo (); this .$refs .drive .getNcsId (); },
5.3.7 自动刷新 这是个比较复杂的功能,需要综合运用 Vue 和 JavaScript 知识,写出来和 debug 都花了我一段时间。
实际上这个自动刷新用的还是上面的 handleGlobalRefresh 函数,只是要定时执行,并且还能调整开关与刷新频率。
先在页面的合适位置放上这两个按钮:
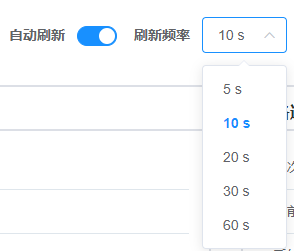
1 2 3 4 5 6 7 8 9 10 11 12 13 14 15 16 17 18 19 20 21 22 23 <el-form class ="searchForm" :model ="refreshParams" ref ="refreshForm" :inline ="true" label-width ="75px" style ="display: inline; margin: 5px 0 5px 15px;" > <el-form-item label ="自动刷新" prop ="autoRefresh" style ="margin-top:5px;" > <el-switch v-model ="refreshParams.autoRefresh" > </el-switch > </el-form-item > <el-form-item label ="刷新频率" prop ="refreshFrequency" style ="margin-top:5px;" > <el-select v-model ="refreshParams.refreshFrequency" placeholder ="请选择" @change ="handleRefreshSetting" style ="width: 85px;" > <el-option v-for ="item in refreshOptions" :key ="item.value" :label ="item.label" :value ="item.value" > </el-option > </el-select > </el-form-item > </el-form >
定义变量,默认情况下开启刷新开关,并设置频率为 10 s:
1 2 3 4 5 6 7 8 9 10 11 12 13 refreshParams : { autoRefresh : true , refreshFrequency : 10000 }, refreshOptions : [ {value : 5000 , label : '5 s' }, {value : 10000 , label : '10 s' }, {value : 20000 , label : '20 s' }, {value : 30000 , label : '30 s' }, {value : 60000 , label : '60 s' }, ], refreshTimer : null ,
当刷新频率发生变化时,即上面的 el-select 选中别的选项时,触发 handleRefreshSetting 函数,处理这个变化:
1
2
3
4
5
6
7
8
9
10
11
handleRefreshSetting ( if (this .refreshTimer ) { clearInterval (this .refreshTimer ); this .refreshTimer = null ; } this .refreshTimer = setInterval (() => { if (this .refreshParams .autoRefresh ) { this .handleGlobalRefresh (); } }, this .refreshParams .refreshFrequency ); },
重点来了 ,由于这是个路由页面,所以可以利用 Vue 路由的导航守卫 (导航表示路由发生改变)和 Vue 的生命周期 destroyed(现已改名为 unmounted ),来处理可能发生的变化,并按不同的变化执行刷新操作。
1
2
3
4
5
6
7
8
9
10
11
12
13
14
15
16
17
18
19
20
21
22
23
24
25
26
27
28
29
30
31
32
33
34
export default { ... beforeRouteEnter (to, from , next ) { next (vm => vm.refreshTimer = setInterval (() => { if (vm.refreshParams .autoRefresh ) { vm.handleGlobalRefresh (); } }, vm.refreshParams .refreshFrequency ); }); }, beforeRouteUpdate (to, from , next ) { if (this .refreshTimer ) { clearInterval (this .refreshTimer ); this .refreshTimer = null ; } next (); }, beforeRouteLeave (to, from , next ) { if (this .refreshTimer ) { clearInterval (this .refreshTimer ); this .refreshTimer = null ; } next (); }, destroyed ( if (this .refreshTimer ) { clearInterval (this .refreshTimer ); } this .refreshTimer = null ; }, ... }
凡是在路由内设置定时器,一定要通过导航守卫去处理它 ,否则会出现离开了详细数据页面,别的页面还在每隔 10 s 自动刷新的 bug。
6 首页的合作伙伴 首页的其他部分是苏州团队做的,下面的合作伙伴是我做的。合作伙伴只要放进公司的 logo 和名称就行了。
1 2 3 4 5 6 7 8 9 10 11 12 13 14 15 16 17 18 19 20 21 22 23 24 25 26 27 <el-row :gutter ="20" style ="margin-bottom:0.5rem" > <el-col :xs ="24" :sm ="24" > <el-card class ="update-log" > <div slot ="header" class ="clearfix" > <span > 合作伙伴</span > </div > <div class ="block" > <el-row :gutter ="20" > <el-col :xl ="2" :lg ="3" :md ="6" :sm ="8" :xs ="12" v-for ="(i, index) in 20" :key ="i" style ="margin-bottom: 0.5rem; height: 70px" > <div style ="text-align: center" > <el-image style ="width: auto; height: 30px; margin: 0 auto" :src ="partnerLogos[index]" fit ="scale-down" > </el-image > <div style ="padding: 10px; text-align: center" > <span > {{ partnerNames[index].abbr }}</span > </div > </div > </el-col > </el-row > </div > </el-card > </el-col > </el-row >
每一个企业都是一个 el-col,分为 logo 的 div 和名称的 div。每一个 el-col 使用了 v-for,所以要绑定 key。
企业的名称写死在 data 中:
1
2
3
4
5
6
partnerNames : [ {full : "德国西门子" , abbr : "德国西门子" }, {full : "江阴塞特精密工具有限公司" , abbr : "江阴塞特" }, {full : "杭州新剑机器人技术股份有限公司" , abbr : "杭州新剑" }, ... ]
企业的 logo 由于位置一致,只是名称不同,因此写个函数去获取它:
1
2
3
4
5
6
7
8
9
10
11
12
13
14
15
16
17
18
data ( return { ... partnerLogos : [], ... }; }, created ( this .getLogos (); }, methods : { ... getLogos ( for (let i = 1 ; i <= 20 ; i++) { this .partnerLogos .push (require ("../assets/partners/" + (i < 10 ? '0' + i : i) + '.png' )); } } }
从 5 月到 7 月,我就在做这些模块的前端开发。与我们之前做的模块不同,这些模块大部分是纯前端工作,比如统计图、设备看板等,除此之外,前端还要构思从后端拿到数据后怎么处理数据的逻辑。拿到变量绑定数据,怎么让它以用户自定义的情况显示?拿到机床主轴数据,怎么让它画成既直观又美观、还让客户满意的图表?都需要我去想想。
因此,越是傻瓜式的页面与操作方式,肯定是程序在背后为你做了越多的事情,这些程序也是程序员的思想结晶。
这个项目已经验收完毕了,通过开发这个项目,我也学会了很多前端的知识,和一些后端、数据库知识。这些知识希望在将来都能用得上。接下来的任务,就是聚焦一个研究方向,好好做科研了。